By
Karin R. Kliemann
Arlington Independent School District
Miriam C. Boesch
University of North Texas
Endia J. Lindo
Texas Christian University
This issue of NASET’s Autism Spectrum Disorder series comes from the Winter 2021 edition of the Journal of the American Academy of Special Education Professionals (JAASEP). Students with an autism spectrum disorder (ASD) are being educated in general education content classrooms that use lessons directed to whole groups of students which limit use of visually presented material. For some students with ASD, having limited visual support hinders their abilities to process and comprehend material. Research shows promising results associated with the use of a graphic organizer to increase comprehension accuracy. The purpose of this study was to document the relationship between using a graphic organizer and increasing reading comprehension for students with ASD. The study used a single-subject, multiple-baseline design across participants to evaluate whether the use of a graphic organizer impacted the accuracy of answering wh-questions for grade-level social studies content. Participants included four eighth-grade students with ASD in an urban public school. Results supported current research by showing an increase in comprehension skills with the use of a graphic organizer.
Abstract
Students with an autism spectrum disorder (ASD) are being educated in general education content classrooms that use lessons directed to whole groups of students which limit use of visually presented material. For some students with ASD, having limited visual support hinders their abilities to process and comprehend material. Research shows promising results associated with the use of a graphic organizer to increase comprehension accuracy. The purpose of this study was to document the relationship between using a graphic organizer and increasing reading comprehension for students with ASD. The study used a single-subject, multiple-baseline design across participants to evaluate whether the use of a graphic organizer impacted the accuracy of answering wh-questions for grade-level social studies content. Participants included four eighth-grade students with ASD in an urban public school. Results supported current research by showing an increase in comprehension skills with the use of a graphic organizer.
Answering Wh-Questions with the Support of Graphic Organizers: Effects on 8th Graders with Autism Spectrum Disorder
In the past two decades, two legislative laws have significantly influenced inclusive opportunities for students with disabilities. The Every Student Succeeds Act(ESSA, 2015) and the Individuals with Disabilities Education Improvement Act (IDEIA, 2004) have mandated participation, increased access, and heightened rigor in the general education curriculum for all students, including those with disabilities. While students are generally experiencing greater participation in inclusive settings, meaningful understanding of general curriculum content continues to be a daily struggle for many students with disabilities. Scores from the National Center for Education Statistics (NCES, 2009) suggest that fourth- and eighth-grade students with disabilities who took part in the test did not understand the grade-level text well enough to comprehend the reading passages (Jitendra & Gajria, 2011). Review of the data from NCES (2017) indicates that scores in reading remain relatively the same for students in 8th grade with an average scale score of 230 in 2009 and 232 in 2017. Similarly, students in 4th grade scored an average of 221 in 2009 and 222 in 2017.
Comprehension Difficulties in ASD
Students with ASD often have additional struggles with reading comprehension based on the compounding social deficits that accompany their disability (Cronin, 2014; Finnegan & Accardo, 2018; Henderson, Clarke, & Snowling, 2014; Jacobs & Richdale, 2013). They experience a “triad of impairments” in the areas of social language and communication, social interaction, and social imagination (Wing & Gould, 1979). This triad affects reading comprehension by imposing difficulties in understanding the perspectives, thoughts, and feelings of others. Students with ASD have difficulties understanding character motivation and subsequent actions based on emotional states. They also struggle to problem-solve and predict events. These skills are related to understanding the perspectives of others and intricacies of social interaction (Carnahan, Williamson, & Christman, 2011; Cashin & Barker, 2009; Fleury & Lease, 2018) which play a large role in comprehending texts in multiple content areas.
To address practices for improving reading comprehension that target the deficits often seen in students with ASD, it is critical to investigate current evidence-based practices in the fields of both reading and autism. As Spencer, Evmenova, Boon, and Hayes-Harris (2014) have noted, much of the existing research focuses on spelling, writing, and direct-instruction practices for mixed elementary grade levels rather than the more in-depth processes involved in comprehension (e.g., mental imagery, connection with prior knowledge, and interpreting meaning from the text). Finnegan and Mazin (2016) recognize that “this position is especially for teachers of students with ASD… as no evidence-based practices in teaching reading comprehension have been identified (p. 190)” for this population.
Evidence-Based Strategies in Comprehension
Teachers of students with ASD rely on evidence-based practices from other student populations and attempt to interpret and modify processes to benefit students with autism (Finnegan & Mazin, 2016). Strategies identified from the National Reading Panel (NRP, 2000), the National Autism Center (NAC, 2015), and the National Professional Development Center on Autism Spectrum Disorder (NPDC, 2014) serve as their main guides. These organizations focus on identifying reading strategies for students from preschool to grade 12, and general content strategies for students with autism. While both the NAC and NPDC do not address reading comprehension, both resources identify practices that show promise when applied to instruction in reading. Detailed information on strategies can be found in the reports on the websites of both the NAC (2015) and NPDC (2014).
Additional research on the use of a visual support for reading comprehension can be found in Whalon and Hanlon’s (2008) investigation of the NRP strategy of cooperative learning. Results indicated increases in unprompted question generation and response during reading instruction. Participants were provided a graphic organizer in the form of a visual story map following the intervention which further increased frequency of question generation and response (Whalon & Hanlon, 2008). Evidence from multiple areas shows promise for the use of visual supports to increase reading comprehension skills for students with ASD.
Graphic Organizers as Visual Supports
Applying the use of graphic organizers to the reading process holds promise for students with ASD by providing a visual framework that shows connections between ideas and promotes the ability to incorporate new learning into existing learning (Kim et al., 2004). Theoretical support for the use of graphic organizers to visually connect ideas and relationships has its roots in Ausubel’s meaningful learning theory (Ausubel, 1963). Meaningful learning theory argued that concept maps and graphic organizers serve as a concrete framework for students to relate existing knowledge to new learning (Kim et al., 2004). Kim et al. (2004) provided further evidence to support Ausubel’s theory in their review of literature from 1963 to 1997 which reported on the success of various graphic organizers in increasing reading comprehension. The following graphic organizers were evaluated and found to be effective in either teacher or research directed interventions: semantic organizers, cognitive maps with mnemonic, cognitive maps without a mnemonic, and framed outlines.
Significance and Purpose of the Study
Research has shown that students with disabilities struggle to understand grade-level texts well enough to comprehend what is being addressed in reading passages. This is particularly true for passages in the social sciences (Hall et al., 2013; Jitendra & Gajria, 2011; Swanson, Wanzek, Vaughn, Roberts, & Fall, 2015). The present study set out to investigate the effects of providing access to graphic organizers to increase reading comprehension for students with autism. This study investigated the following research questions: (1) Is there a functional relationship between the use of graphic organizers and reading comprehension as measured by answering wh-questions in grade level social studies content for students with ASD? (2) Can teachers be trained to implement the graphic organizer intervention with fidelity? (3) What is the social validity of using graphic organizers in an inclusive general education classroom for students with ASD as measured by feedback from parents, student participants, and teachers?
Method
Participants
With approval from the university institutional review board, four eighth grade students with autism spectrum disorder (ASD) were recruited from an urban junior high school in the southwest United States. The researchers targeted this population given that historically students receiving special education services in grade eight do not meet the passing standard for content knowledge in social studies (AEIS, 2011). The school represented a convenience sample based on the school district in which the first author works. Participants, meeting the following criteria were selected for inclusion in this study. Each student:
- had an educational determination of ASD based on district protocols in agreement with the Diagnostic and Statistical Manual of Mental Disorders (APA, 2013) and using standardized measures administered by a licensed specialist in school psychology (LSSP);
- had IQ ranges from 65 to 120 as measured by a Wechsler Intelligence Scale for Children (WISC), Kaufman Assessment Battery for Children (KABC), or Woodcock Johnson IV (WJ-IV) (Schrank, McGrew, Mather, & Woodcock, 2014);
- had the ability to speak in full sentences; make personal needs known; answer factual and literal wh-questions; understood vocabulary common to typically developing same-age peers, based on a review of the full individual evaluation (FIE) including but not limited to, results of a current Assessment Test of Pragmatic Language, the Pragmatics Profile, or the Adaptive Behavior Assessment, if available;
- were between 13 to 14 years of age; and
(e) had a designated IEP time in a curriculum that reflected services and support for social studies content in a general education setting.
Students who had a history of challenging behaviors, including significant tantrums or aggression, were excluded from participation to maintain the focus on improving reading comprehension and not compound the intervention with behavior shaping techniques.
Data summaries for each participant were gathered by reviewing the student’s most recent Full and Individual Evaluation (FIE), which law mandates must be reviewed and considered every three years. The FIE dates, comprehensiveness of evaluation summaries, and tools used for assessing the components of autism, language, cognitive, and achievement components varied among the participants (pseudonyms used; see Table 1 for results).
Participant 1: Jack. FIE date: 2016. A 14-year-old Caucasian male, identified as a student with ASD through several diagnostic measures (see Table 1). In the area of language, Jack was within the normal range and verbally communicated his ideas, preferences, and needs using complex sentence structures. He presented with a comorbid diagnosis of an Intellectual Disability which is consistent with some individuals on the autism spectrum. Based on the Woodcock Johnson IV Tests of Achievement (WJ IV.), Jack also met criteria for dyslexia. The examiner noted that Jack’s General Intellectual Ability (GIA) score from the Woodcock Johnson IV Tests of Cognitive Abilities (WJ IV COG, 2014) was not cohesive with the subtest information, which should not be interpreted as reliable. Jack was administered the Adaptive Behavior Assessment, Third Edition (ABAS-3) to identify his overall areas of strength and weakness. Summary recommendations noted the importance of emphasizing Jack’s strength of Visual Processing by providing visual material.
Participant 2: Kevin. FIE date: 2013. A 14-year-old Asian male, educationally identified as having severe ASD via the Childhood Autism Rating Scale, Second Edition–High Functioning Version (CARS2-HF). His numeric score of the Autism Diagnostic Observation Schedule (ADOS-2) was not reported in the FIE results. However, the summary statement supported that Kevin’s overall performance fell within the autism classification. In the area of language, Kevin showed an impairment in pragmatic language. While formal testing indicated Kevin performed below peers his age, he verbally communicated his preferences and needs using compound and complex sentence structures. Kevin usually understood what was said to him and asked for help when needed. Kevin rarely answered questions or participated in classroom discussions. Kevin’s cognitive performance was found to be below the average range. However, the examiner stated that the results should be viewed with caution due to Kevin’s diagnosis of autism. Achievement testing was assessed using the Classroom Assessment Scoring System (CLASS), a criterion-referenced assessment tool in which Kevin performed at the beginning first-grade level at the time of the assessment in 2013. Unfortunately, FIE did not contain any more recent data on achievement.
Participant 3: Ethan. FIE 2012. A 14-year-old Caucasian male identified as having ASD as indicated using the CARS-2-HF (mild-moderate category) and the module 2 of the ADOS-2. The ADOS-2 overall numeric score was not reported in the FIE results, but the summary statement supported that Ethan’s performance fell within the autism classification. In the area of language, Ethan showed an impairment in pragmatic language and performed below his same-aged peers. He verbally communicated his preferences and needs using compound and complex sentence structures. Ethan usually understood what was said to him and asked for help when needed. It was noted that Ethan rarely answered questions or participated in classroom discussions. Ethan showed to be in the average range of intelligence. Ethan was also noted to be below the average range by his teacher in the areas of communication and functional academics as per the KABC-II. The examiner noted that Ethan’s intellectual functioning and adaptive behavior scores were not consistent. Formal or informal achievement testing was not reported in the current FIE. Because Ethan had intellectual scores in the average range, it was concluded that Ethan performed on or close to grade level.
Participant 4: Daniel. FIE date: 2014. A 13-year-old Caucasian male educationally identified with ASD using the Autism Spectrum Rating Scales (ASRS) and ADOS. Two teacher ratings on the ASRS revealed Daniel had difficulty relating to children and tolerating changes in routine, used language in an atypical manner, engaged in unusual behaviors, and had problems with attention and/or impulse control. However, these behaviors were not significant enough to impact his participation in the present study. The examiner reported that parent ratings on the ASRS indicated Daniel had difficulty tolerating changes in routine, used language in an atypical manner, engaged in unusual behaviors, overreacted to sensory stimulation, and had difficulty focusing. In the area of language, Daniel expressed himself using complex sentences, answered when called on after being given a “wait time,” and asked for clarification when needed. Daniel had cognitive performance within the average range, and his adaptive behavior was consistent with his intellectual functioning. Formal or informal achievement testing was not reported in the current FIE. However, with intellectual scores in the average range, it was concluded that Daniel was performing on or close to grade level.
Table 1. Assessment Summary for Participants
|
Participant |
Assessment |
Score |
Conclusion |
|
Jack 14 yr. |
ASRS |
Social Communication = 68 (T) 64 (P) Peer Socialization = 77 (T) 68 (P) Social Emotional = 66 (T) 58 (P) Behavioral Rigidity = 71 (T) 60 (P) Sensory Sensitivity = 65 (T) 59 (P) |
ASD |
|
ADOS-2, module 3 |
8 |
ASD |
|
|
TOPL-2 |
87 |
Normal range |
|
|
WJ IV-COG |
67 |
Noted not cohesive with subtest information; interpret as not accurate |
|
|
ABAS-3 |
Below average |
Below average in communication & functional academics; visual processing strength |
|
|
WJ IV |
Math Problem Solving = 95 Basic Reading = 68 Comprehension = 79 Reading Fluency = 58 Math Calculations = 77 Written Expression = 67 |
Overall below average reading comprehension & reading fluency |
|
|
Note: ABAS-3 = Adaptive Behavior Assessment, ADOS-2 = Autism Diagnostic Observation Schedule, ASD = autism spectrum disorder, ASRS = Autism Spectrum Rating Scale, P = Parent, T = Teacher, TOPL-2 = Test of Pragmatic Language, WJ IV-COG = Woodcock Johnson IV Tests of Cognitive Abilities, WJ IV = Woodcock Johnson IV Tests of Achievement. Numbers indicate the specific edition of the particular assessment. |
|||
(Continued)
Table 1. Assessment Summary for Participants – cont’d
|
Participant |
Assessment |
Score |
Conclusion |
|
Kevin 14 yr. |
CARS2-HF |
37 |
Severe ASD |
|
ADOS-2, module 3 |
Score not reported |
ASD |
|
|
Pragmatic Profile |
104 |
pragmatic language impairment |
|
|
KABC-II |
Below average range |
viewed with caution |
|
|
ABAS-2 |
Teacher only report = 71 |
Below average in communication & functional academics; strength in visual processing |
|
|
CLASS |
Beginning 1st grade |
Assessment in 2013 |
|
|
Ethan 14 yr. |
CARS2-HF |
28 |
Mild to moderate ASD |
|
ADOS-2, module 2 |
Score not reported |
ASD |
|
|
Pragmatic Profile |
104 |
pragmatic language impairment |
|
|
KABC-II |
Average |
|
|
|
ABAS-2 |
Teacher report only = below average |
Below average in communication & functional academics |
|
|
Achievement testing |
Not reported |
|
|
|
Daniel 13 yr. |
ASRS |
Score not reported |
Atypical for language, changes in routine, & sensory stimulation |
|
ADOS |
Communication = 3 Reciprocal Interaction = 8 |
ASD |
|
|
TOPL-2 |
102 |
Average |
|
|
WJ IV-COG |
Average |
|
|
|
Adaptive Behavior (noted informal assessment) |
Average |
|
|
|
Achievement testing |
Not reported |
At grade level |
|
|
Note: ABAS-2, 3 = Adaptive Behavior Assessment, ADOS-2 = Autism Diagnostic Observation Schedule, ASD = autism spectrum disorder, ASRS = Autism Spectrum Rating Scale, CARS2-HF = Childhood Autism Rating Scale-High Functioning, CLASS = Classroom Assessment Scoring System, KABC = Kaufman Assessment Battery for Children, TOPL-2 = Test of Pragmatic Language, WJ IV-COG = Woodcock Johnson IV Tests of Cognitive Abilities, WJ IV = Woodcock Johnson IV Tests of Achievement. Numbers indicate the specific edition of the particular assessment. |
|||
Setting
This study took place in a public-school classroom setting. Baseline and intervention sessions were conducted in a specialized support classroom designed to provide instruction to students receiving special education services. Environmental materials included a chair and desk of appropriate size for each participant and a chair for the interventionist.
The interventionists sat at a 45- to 90-degree angle across the table from the student. Each session lasted no longer than 30 minutes.
During the baseline and intervention phase of training, the teacher and student were present. The first author and independent observer attended periodically to conduct data collection for inter-rater reliability. The generalization phase included the implementation of a graphic organizer into an inclusive general education social studies classroom at the eighth-grade level. Prior to the intervention, baseline probes were taken in the general education setting for just one component of the treatment package (answering wh-questions) for each participant. The probe information is included in the data reporting.
Instrumentation and Materials
The district assesses all students on the Istation Internet-based assessment Indicators of Progress (ISIP; Mathes & Torgesen, 1998). The ISIPprovides assessments and curriculum lessons in reading and math, and the district uses it to obtain students’ independent reading levels so teachers may provide targeted reading instruction. Typical grade-level peers score between 278 and 289 in comprehension on the ISIP reading ability assessment. This assessment was utilized with participants to ensure that text selection for intervention was on a level commensurate with each participant’s score and at an independent reading level. Participants recruited for this study had scores ranging from 240 to 277 in comprehension on the ISIP reading ability assessment. These scores were used to analyze texts for readability, vocabulary, and decoding. Passages were identified from leveled readers that closely aligned to the topics to help control for external bias and maintain the intervention’s fidelity. The texts chosen for the study covered general topics for eighth-grade social studies content based on the general education scope and sequence and state curriculum standards.
A series of eight words for sorting and eight teacher questions based on the social studies passage were developed by the researcher. The questions had two questions from each category: who, what, where, what doing/what for which matched the categories on the graphic organizer used in the intervention. Participants were provided with the graphic organizer template at the beginning of the session (Figure 1), a reading book appropriate for the participant, and a bookmark to track reading if needed for the intervention sessions. Participants were also provided with a visual schedule or “to-do” sheet detailing which reading needed to occur and how many questions needed to be answered after the reading.
|
Who |
What |
|
Where |
What Doing/What Purpose |
Figure 1. Graphic Organizer
Experimental Design
The study used a single-subject multiple-baseline (A-B and generalization) design across participants to investigate the impact of a graphic organizer on answering wh-questions in a staggered phase change design. There were three phases in the study including baseline, intervention and generalization.
Baseline phase. The data collection at baseline for answering wh-questions used a concurrent design with a staggered phase change in the participants’ classrooms. Typical instruction procedures in the school’s general education social studies classroom involved the teacher lecturing on content while the students had access to a note page or summary of reading high points on their desks. Standard practice was for students to read passages or to listen to the lecture and answer wh– questions about the content. Thus, baseline procedures comprised of the standard instructional practices without having the graphic organizer present. Data collection for the baseline phase for wh-questions began at the same time for all participants. Once data stability, a minimum of four data points, was reached for the first participant and intervention was introduced, baseline continued for the remaining participants. This cycle was repeated for participants two, three, and four until the last participant entered the intervention phase.
Intervention phase. Intervention was conducted until a change occurred in the measured behaviors. The intervention phase for the second participant began when the data points for the first participant’s intervention phase showed an upward trend evident after 3 to 5 data points. This rolling introduction of the intervention phase was used for the remaining two participants. Intervention sessions were conducted in the same location as the baseline phase.
The interventionists introduced the materials for the lesson at the beginning of each session and stated the topic. This allowed the participants to preview the material for any unknown words and ask questions for clarification. Then, the participants were instructed to read the passage. When the participants were finished, the interventionists provided the index cards that contained individual words from the reading. The participants were instructed to place the words in one of the four categories on the graphic organizer.
Once the participants had sorted the words (regardless of accuracy) onto the graphic organizer, the interventionists presented eight index cards, each containing a question related to the reading. At the end of each session, the interventionists reviewed the number of correct responses with the participants and provided verbal praise for correct answers. Sessions for intervention were conducted weekly.
Follow-up phase. After the intervention phase concluded and a minimum of a 1-week break was given due to the statewide testing calendar, three follow-up sessions were conducted for each participant. This follow-up phase was conducted in an inclusive general education classroom for social studies or in the special education classroom depending on time of day. Classroom procedures were similar to a typical lesson format described in the baseline phase. It consisted of a traditional teacher lecture with note page or reading summary document on their desk but also included a graphic organizer with word sorting cards to help answer wh-questions related to the lesson. These sessions were completed either in the general education classroom or in a special education classroom following the class period. The general education teachers’ schedules and participants’ comfort levels determined where the sessions were conducted.
Interventionists
Teacher interventionists. Two teachers provided intervention to the participants. These teachers were the participants’ current support teachers and were certified in K–12 special education and 4–8 generalist. The female teacher had 14 years of teaching experience while the male teacher had four years of teaching experience. The participants’ special education teachers served as the interventionists to (1) minimize the potential heightened anxiety of the participants with ASD due to changes in personnel, (2) increase the participants’ abilities to transfer the learned skills across tasks by conducting the intervention with familiar teachers in the setting where they were expected to perform the skills, and (3) increase the flexibility of the intervention session scheduling of the teachers.
Interventionist training.The first author trained each teacher responsible for intervention in the following areas: (a) creation and use of the graphic organizer, (b) data collection procedures, and (c) steps in the intervention implementation. Training involved a combination of approaches to ensure student understanding and success upon implementation as well as a discussion of presentation of materials. Both interventionists demonstrated the ability to present the material for intervention following the protocol in the training session at 100% mastery based on researcher observation. The first author addressed both nonverbal body language and paraverbal language to maximize the neutral presentation of information. While nonverbal language consists of body language and gestures, paraverbal language refers to a person’s tone, volume, and cadence of speech. Training in paraverbal language was given to minimize unintended teacher influence.
During training, the interventionists had opportunities to ask questions and practice the intervention and receive implementation feedback. Total training time was estimated at 30 minutes per interventionist and was completed prior to implementing it with the student participants. Training occurred at each interventionist’s junior high campus during the planning period. Training sessions were recorded on an Apple iPad®.
An instructional specialist employed by the district served as an independent observer and teacher fidelity rater. The independent observer was present for two intervention sessions per participant. Following observation of two sessions, the independent observer then viewed the electronic recording of the training sessions and rated sessions according to the checklist for lesson presentation to ensure fidelity across support teachers.
Data Collection and Analysis
This study measured reading comprehension as the dependent variable. In doing so, it used a graphic organizer designed with four categories corresponding to the topics of the wh-questions asked following a reading passage. Topic headings were; who, what, where and what for. Data obtained for answering wh-questions were graphed as percent correct for analysis. Data collection involved noting responses to wh-questions. Effect sizes were also calculated using the Percentage of Non-overlapping Data (PND). Interpretation ranges for effectiveness with PND are: 91% to 100% highly effective, 71% to 90% moderately effective, 50% to 70% minimally effective, and below 50% not effective.
Interobserver Agreement
Interobserver agreement (IOA), defined as the agreement between independent observers on intervention responses, was calculated to ensure integrity of the measurement process. The first author served as the primary observer, and an instructional specialist supporting the campus served as the secondary observer. The IOA consisted of four sessions for answering wh-questions. During the follow-up phase, the primary and secondary observers scored three sessions for answering wh-questions. The primary and secondary observers privately recorded correct and incorrect responses of answering wh- questions.
The IOA for the intervention phase was 100% for all sessions rated. Both the primary and secondary observers indicated 100% agreement for wh-questions answered across sessions observed for each participant with each interventionist. During follow-up probes, the IOA was also 100%, as both observers indicated 100% agreement across participants.
Social Validity
Social validity relates to the acceptability of the goals, methods, and outcomes of treatments by consumers (Wolf, 1976). A questionnaire was developed to support the work of Reichow, Doehring, Cicchetti, and Volkmar (2011). Six of the seven indicators met by the questionnaire were: (a) consumers are satisfied with results, (b) clinically significant behavior changes are achieved, (c) a socially important dependent variable exists, (d) the study is time and cost effective, (e) independent variable intervention was conducted by people who typically come into contact with the participant, and (f) intervention occurred in a natural environment. The only criterion not addressed was the comparison between students with and without disabilities. The questionnaire was distributed to the parents, teachers, and participants at the study’s conclusion. The results of the questionnaire were analyzed by reporting value ratings on all six questions across audiences. Results were compared according to question and audience.
Results
Figure 2 illustrates the data on the use of a graphic organizer to answer wh-questions. Data were collected on the percentage of questions answered correctly. Data results for answering wh-questions mirrored those noted in Bethune and Wood (2013) with participants experiencing an increase in the number of questions answered correctly during intervention and follow-up phases. Prior to intervention, baseline probes for wh-questions were conducted in the general education setting. Ethan was the only participant who answered one question correctly in that phase. Due to schedule restrictions with state and district-wide testing, no more than a total of 8 sessions were conducted per participant. Data were graphed using Microsoft Excel and visually inspected for level stability and trends, compared to the participants’ baseline measures, and interpreted. Data were visually analyzed for immediacy of effect.
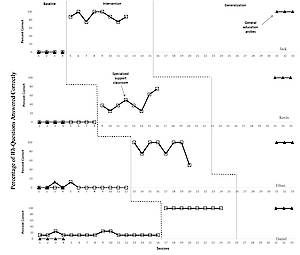
Figure 2: Percentage of correctly answered wh-questions.
Triangles represent maintenance probes for answering wh-questions. Squares represent baseline and intervention responses for wh-questions.
Results for Each Participant
Jack. Baseline data for Jack was 0% in the specialized setting and 0% for general education probes. During intervention, data for answering wh-questions ranged from 75% to 100%. Jack’s data for the maintenance phase probes was 100%. Median for Jack during intervention was 93.9%. The data also showed a stable and flat trend line. There was an immediacy of effect upon introducing the intervention. The PND score was100% which is interpreted as a highly effective effect size.
Kevin. Baseline data for Kevin was 0% in the specialized setting and 0% for general education probes. During intervention, data for answering wh-questions ranged from 25% to 62.5%, with an overall average of 42%. Kevin’s data for the maintenance phase probes was 100%. Median for Kevin during intervention was 37.5%. There was also some variability in the data with an upward trend. There was an immediacy of effect upon introducing the intervention. The PND score was 100% which is interpreted as a highly effective effect size.
Ethan. Baseline data for Ethan was 0% in the specialized setting and 12.5% for general education probes. Ethan was able to answer one question asked of him in both settings prior to intervention at the time of observation. During intervention, data for answering wh-questions with the graphic organizer ranged from 50% to 100%. Ethan’s data for follow-up phase was 100%. Median for Ethan during intervention was 100%. Stability would have been met with one additional data point in the 20% range. There was some data some variability in the data with a mostly flat trend line. However, the last data point appeared to be an outlier as Ethan’s accuracy greatly decreased compared to the previous intervention data. There was an immediacy of effect upon introducing the intervention. Despite the outlier, the PND score was 100%, which is interpreted as a highly effective effect size.
Daniel. Baseline data for Daniel was 12.5% in the specialized setting and 0% for general education probes. Daniel was able to consistently answer one to two questions in the specialized setting prior to intervention. During intervention, Daniel answered all wh-questions during all sessions yielding 100%. Data for the follow-up phase were also 100%. Median for Daniel during intervention was 100% with, all of his intervention sessions at 100%. Trend data indicated a flat line; and upon introducing the intervention there was an immediacy of effect. The PND score was100% which is interpreted as a highly effective effect size.
Table 2 summarizes the percentage of correctly answered wh-questions at baseline and intervention, noting mean, median, and range for each participant.
Table 2. Mean, Median, and Range of Wh-Questions Data
|
|
Baseline |
|
Intervention |
||||
|
Participant |
Mean |
Median |
Range |
|
Mean |
Median |
Range |
|
Jack |
0 |
0 |
0 |
|
90.7 |
93.9 |
75-100 |
|
Kevin |
0 |
0 |
0 |
|
42.25 |
37.5 |
25-62.5 |
|
Ethan |
0 |
0 |
0-1 |
|
87.5 |
100 |
50-100 |
|
Daniel |
1.2 |
1 |
1-2 |
|
100 |
100 |
0 |
Procedural/Implementation Fidelity
This study also examined whether there was a functional relationship between teacher training, implementation of intervention fidelity, and participant success. Evidence shows teachers were trained to implement the intervention. Procedural fidelity measures included data evaluating two components identified in the work of Lynch and O’Donnell (2005). The first component was related to process components which address the quality of delivery. This fidelity measure was included in the intervention description as the interventionist received training prior to implementation (Lynch & O’Donnell, 2005). Intervention fidelity was measured through observation using the Fidelity of Implementation Checklist (Table 3), which denoted areas covered in the training of teachers prior to implementation of the intervention. The checklist allowed for consistency of implementation and assessed for procedural fidelity across interventionists during intervention. Two intervention sessions were observed by the first author and the second observer. The first author and the second observer then reviewed the recorded training session independent of each other and scored components using the checklist for implementation. Fidelity of Intervention was achieved at 76.5% for both interventionists. The observers marked 13 of the 17 steps as Yes to indicate the steps were completed by the interventionists. The four steps that were marked No were steps related to the use of the “to-do” list. As noted in Table 3, these steps were not needed for the intervention presentation as the participants understood the steps in the task after the first presentation session.
All participants understood the process after the first session and were able to sort words on the graphic organizer independently. Answering wh-questions increased across all participants during the intervention, which could be correlated to the use of a consistent routine established by the interventionists and the checklist.
Procedural fidelity processes also includedmeasures in the structure of intervention. The following were evaluated (Lynch & O’Donnell, 2005): (a) adherence to the unit of study—Was the unit delivered as written? (b) exposure—Were length, time, and skills received as intended? (c) program differentiation—Were there differences from the standard curriculum? Data for 20% of the sessions during intervention were assessed. Measures in the structure of intervention included monitoring the session lesson plans and analyzing the completed data sheets to ensure adherence to the unit of study and time sequence outlined in the intervention description. The third area under structure of intervention measures did not present fidelity concerns since the curriculum was state approved for grade-level social studies.
Table 3. Fidelity of Intervention Implementation Checklist Results
|
Category |
Step |
Interventionist |
|
|
1 |
2 |
||
|
Session setup |
Place the table and chairs in their proper positions. |
Y |
Y |
|
Prepare the “to-do” list. |
Y |
Y |
|
|
Place the materials for the session (“to-do” list, graphic organizer, and reading text) on the table. |
Y |
Y |
|
|
Procedures for beginning intervention |
Greet the student. |
Y |
Y |
|
Present the session topic. Teacher will state the topic. Teacher will ask the participant to preview material for any unknown vocabulary. |
Y |
Y |
|
|
Present the session “to-do” list. |
Y |
Y |
|
|
Check for understanding. Teacher will ask the participant to read the “to-do” list. |
N |
N |
|
|
Verbally direct the student to the reading material and graphic organizer. |
Y |
Y |
|
|
Allow the student time to read the passage. |
Y |
Y |
|
|
Procedures following reading of the passage |
Refer to the “to-do” list to indicate what has been concluded and what is next. |
N |
N |
|
Present 8 cards with words on them for sorting. |
Y |
Y |
|
|
Allow the student to sort the cards on the graphic organizer. |
Y |
Y |
|
|
Remove the organizer to the side of the work space. |
Y |
Y |
|
|
Use the “to-do” list to indicate what is next. |
N |
N |
|
|
Ask the student the set of questions. |
Y |
Y |
|
|
Record responses as correct or incorrect. |
Y |
Y |
|
|
Refer to the “to-do” list to indicate the conclusion of the session. |
N |
N |
|
|
Note: Y = yes, N= no. The “to-do” list was not needed for any participants following the initial intervention session. |
|||
Social Validity
For the final research question, a social validity questionnaire designed to obtain information from the stakeholder groups to address three factors was used. The indicators of (a) satisfaction and (c) evidence of socially important variables were used as identified in Reichow et al. (2011). The social validity indicator, (b) significant behavior change, was achieved based on the intervention and outcome results. Additional data answered whether the use of a graphic organizer proved useful to the participants which further addressed indicators (b) and (c). The overall design of the study addressed the final indicator (d) overall time and cost effectiveness (Reichow et al., 2011).
All four students, both teachers, and two parents completed their questionnaires (80% return rate). Overall results from students indicated they felt the intervention was explained well (n = 2) or explained pretty well (n = 2). Three of the students indicated that the intervention was very important to them in comprehending reading passages in social studies content. The fourth student indicated it was somewhat important to comprehending reading passages. Teachers reported high satisfaction in all areas for the intervention and high value in the intervention continuing to make a difference in comprehension. One teacher reported being very satisfied with the overall intervention results and both teachers reported yes on positive progress with continued intervention. Both parents indicated the intervention would continue to make a difference in comprehension, seeing the importance of using it to teach comprehension, and that their child had expressed frustration with schoolwork periodically in the past. Results suggest using graphic organizers in an inclusive general education classroom for students with ASD yields high social validity in six of the seven criteria identified by Reichow et al. (2011).
Discussion
The purpose of this study was to extend the existing research in reading comprehension for students with ASD. Specifically, the degree of impact of graphic organizers on reading comprehension as measured by answering wh-questions in social studies content. The aim was to provide evidence that supported the use of graphic organizers in content areas other than reading to benefit students with ASD in gaining knowledge and skills in a variety of core content classes. Results of the data gathered for the three research questions demonstrated graphic organizers have the potential to help students with ASD understand content more successfully, teacher training on implementation of the strategy may impact student success, and teachers, participants and parents see the strategy as holding relatively high social validity.
Research question (RQ) 1 hypothesized whether there was a functional relationship between the use of graphic organizers and reading comprehension measured by evaluating the answering of wh-questions in grade level social studies content for students with autism. The intervention yielded increases for all participants in answering wh-questions. There was an immediacy of effect observed with all four participants upon introducing the intervention phase, and there were no overlapping data when comparing the baseline data against the intervention data, thus, yielding highly effective intervention effects across all participants. These results support similar findings by Bethune and Wood (2013), Iguatova (2013), and O’Conner and Klein (2004). Their studies measured the participants’ abilities to answer questions about text read. They reported an increase in answering questions and found functional relationships between the use of graphic organizers and correct responses to questions.
RQ2 addressed whether teachers could be trained to implement the intervention with fidelity. Findings indicated teachers utilized the checklist for intervention with 76.5% fidelity (13 of 17 steps). All four participants learned the sequence of the intervention after the first session, and three participants (Ethan, Jack, and Daniel) were able to set up the intervention with no teacher prompting and worked independently through the sessions after the second session. Kevin required verbal prompting to begin reading through the fourth session. However, a strength for this study was that the participants quickly showed they did not require a “to-do” list. Therefore, the “to-do” steps were not presented as the participants perceived them as unnecessary and unauthentic. While the percentage of correct adherence to the fidelity of intervention procedures was lower due to the omission of four steps deemed as unnecessary by the interventionists, overall satisfaction and ease of intervention was strengthened.
RQ3 addressed whether participants, parents, and teachers found the use of graphic organizers in an inclusive setting for students with ASD as socially valid. Using the components identified in the research of Reichow et al. (2011), results received from the three groups indicated strong social validity for the intervention. Areas of strength included (a) easy to implement the intervention, (2) required little to no time or materials, (3) resulted in immediate behavior changes and (4) the intervention was valuable to student success.
Implications for Practice
Using teachers as primary implementers strengthened the existing relationships with campus grade-level staff and minimized further anxiety potentially produced for students with ASD when introduced to new personnel. Additionally, findings showed high social validity for the intervention with relatively low teacher preparation and training required. By incorporating the intervention into a teacher’s existing planning time, it has the potential to be highly beneficial for students with autism while minimizing the additional strain on teachers’ planning processes for lesson preparation.
Limitations and Directions for Further Research
While the intervention procedure implemented in the current study yielded strengths, there are notable limitations and implications for future research. One potential limitation was that the participant intervention phases were concluded at a set number of sessions rather than extending sessions across participants. The intervention sessions were limited, and follow-up probes were delayed due to district testing schedules and the teachers’ lesson schedules. As a result, probes for follow-up were not collected until some weeks following the conclusion of the intervention, and the delay varied for each participant with the first participants experiencing a longer break than the last participant. Ethan’s data specifically, denotes a significant limitation in the 8th session. Future research is needed to determine if differences exist when the participants are in the intervention phase for more than eight sessions and when the participants receive the same break period across tiers before the follow-up phase begins. Extended intervention sessions are important to ensure data stability using the 80%-20% rule (Gast, 2010; Haegele & Hodge, 2015) across all participants.
Further, the intervention may have been strengthened by investigating the use of different visual supports. As students with ASD continue to have access to inclusive settings, it will be important for researchers to continue to extend the work of Kim et al. (2004) by conducting investigations using cognitive mapping or mnemonic devices. A consideration for future researchers is to design a similar study utilizing a graphic organizer for answering wh-questions from a text passage that is read aloud by a teacher. This would allow investigators to measure a student’s ability to respond after listening to the text instead of reading it independently. Future research should also consider using other visual support strategies in academic subject areas beyond social studies with varying ages of students. Findings would provide direction on implementation for practitioners across multiple content and grade levels. One additional area that would strengthen the results of this study is to replicate the study with more than four students as using a small participant pool limits the generalizability of the findings.
In closing, the findings from this study show that with a little time and effort, teachers can implement the use of graphic organizers in a way that allows students to successfully answer wh-questions during social studies lessons. By using socially valid strategies that are not time consuming to develop, to train, or to implement, they have the potential to increase a teacher’s willingness to use those strategies for students with ASD. Graphic organizers are concrete tools that can assist teachers in authentically engaging students with ASD in their classrooms and, therefore, potentially maximize the student’s academic potential.
References
Ausubel, D. P. (1963). The psychology of meaningful verbal learning. New York: Grune & Stratton.
Bethune, K.S., & Wood, C. L. (2013). Effects of wh-question graphic organizers on reading comprehension skills of students with autism spectrum disorders. Education and Training in Autism and Developmental Disabilities, 48, 236-244.
Carnahan, C. R., Williamson, P. S., & Christman, J. (2011). Linking cognition and literacy in students with autism spectrum disorder. TEACHING Exceptional Children, 43(6), 54-62.
Cashin, A., & Barker, P. (2009). Triad of impairments in autism revisited. Journal of Child and Adolescent Psychiatric Nursing, 22(4), 189-193.
Cronin, K. A. (2014). The relationship among oral language, decoding skills, and reading comprehension in children with autism. Exceptionality: A Special Education Journal, 22 (3), 141-157.
Every Student Succeeds Act (ESSA) of 2015, PL 114-95, 20 U.S.C. §§ 6301 et seq.
Finnegan, E., & Accardo, A. L. (2018). Understanding character perspective: Strategies to support students with autism spectrum disorder. The Reading Teacher,72, 71-80.
Finnegan, E., & Mazin, A. L. (2016). Strategies for increasing reading comprehension skills in students with autism spectrum disorder: A review of the literature. Education and Treatment of Children, 39, 187-220.
Fleury, V. P., & Lease, E. M. (2018). Early indication of reading difficulty? A descriptive analysis of emergent literacy in children with autism spectrum disorder. Topics in Early Childhood Special Education, 39(2), 82-93.
Gast, D. L. (2010) Single subject research methodology in behavioral sciences. New York, New York: Routledge.
Haegele, J. A., & Hodge, S. R. (2015). The applied behavior analysis research paradigm and single-subject designs in adapted physical activity research. Adapted Physical Activity Quarterly 32, 285 -301. https://doi.org/10.1123/APAQ.2014-0211
Hall, C., Kent, S.C., McCulley, L., Davis, A., & Wanzek, J. (2013). A new look at mnemonics and graphic organizers in the secondary social studies classroom. TEACHING Exceptional Children, 46, 48-55.
Henderson, L. M., Clarke, P. J., & Snowling, M. J. (2014). Reading comprehension impairments in autism spectrum disorders. Topics in Cognitive Psychology, 114. 779-797.
Individuals with Disabilities Education Improvement Act (IDEA) of 2004, PL 108-446, 20 U.S.C. §§ 1400 et seq.
Jacobs, D. W., & Richdale, A. L. (2013). Predicting literacy in children with high-functioning autism spectrum disorder. Research in Developmental Disabilities, 34(8), 2379-2390.
Jitendra, A. K., & Gajria, M. (2011). Reading comprehension instruction for students with learning disabilities. Focus on Exceptional Children, 43(8), 1-16.
Kim, A., Vaughn, S., Wanzek, J., & Wei, S. (2004). Graphic organizers and their effects on the reading comprehension of students with LD: A synthesis of research. Journal of Learning Disabilities, 7, 105-118.
Lynch, S., & O’Donnell, C. (2005, April). “Fidelity of implementation” in implementation and scale-up research designs: Applications from four studies of innovative science curriculum materials and diverse populations. Paper presented at the annual meeting of American Educational Research Association, Montreal, Canada.
Mathes, P.G., & Torgeson, P.G. (1998). All children can learn to read: Critical care for the prevention of reading failure. Peabody Journal of Education, 73(3), 317-340
National Autism Center (2015). National standards report. Retrieved from: www.nationalautismcenter.org/pdf/NAC%20Standards%20Report.pdf
National Center for Education Statistics (2009). The Nation’s Report Card: Reading 2009 (NCES 2010-458). Washington, DC: National Center for Education Statistics, Institute of Education Sciences, U.S. Department of Education.
National Center for Education Statistics (2011). The Nation’s Report Card: Reading 2011 (NCES 2012-457). Washington, DC: National Center for Education Statistics, Institute of Education Sciences, U.S. Department of Education.
National Professional Development Center on Autism Spectrum Disorders (2014).
National Reading Panel (2000). Teaching children to read: An evidence-based assessment of the scientific research literature on reading and its implications for reading instruction.
Reichow, B., Doehring, P., Cicchetti, D.V., & Volkmar, F. R. (2011). Evidence-based practices and treatments for children with autism. New York, NY: Springer.
Schrank, F.A., McGrew, K.S., Mather, N., & Woodcock, R.W. (2014). Woodcock-Johnson IV. Rolling Meadows, IL: Riverside Publishing.
Spencer, V. G., Evmenova, A. S., Boon, R. T., & Hayes-Harris, L. (2014). Review of research-based interventions for students with autism spectrum disorders in content area instruction: Implications and considerations for classroom practice. Education and Training in Autism and Developmental Disabilities, 20, 331-353.
Swanson, E., Wanzek, J., Vaughn, S., Roberts, G., & Fall, A.M. (2015). Improving reading comprehension and social studies knowledge among middle school students with disabilities. Exceptional Children, 81(4), 426-442.
Whalon, K., & Hanline, M.F. (2008). Effects of a reciprocal questioning intervention on the question generation and responding of children with autism spectrum disorder. Education and Training in Developmental Disabilities, 43, 367-387.
Williamson, P., Carnahan, C.R., Birri, N., Swoboda, C. (2015). Improving comprehension of narrative using character event maps for high school students with an Autism Spectrum Disorder. The Journal of Special Education, 49(1), 28-38.
Wing, L., & Gould, J. (1979). Severe impairments of social interaction and associated abnormalities in children: epidemiology and classification. Journal of Autism and Developmental Disorders, 9, 11-29.
Wolf, M. M. (1978). Social validity: The case for subjective measurement or how applied behavior analysis is finding its heart. Journal of Applied Behavior Analysis, 11, 203-214.
About the Authors
Karin R. Kliemann, Ph.D. is a Special Education Curriculum Coordinator for the Arlington Independent School District. Her focus is on supporting teachers in the application of evidenced based practices for students with autism as well as students with an emotional disturbance. She provides professional learning opportunities for teachers, administrators and other staff members in the areas of functionally analyzing behavior, teaching replacement behavior, and use of visual strategies for increased success. Dr. Kliemann also facilitates district-wide support services for social emotional learning for the special education department.
Miriam C. Boesch, Ph.D. is an Associate Professor of Special Education in the Department of Educational Psychology at the University of North Texas. Her research focuses on augmentative and alternative communication (AAC). Specifically, Dr. Boesch engages in AAC research to assess teacher preparation needs, compare strategies suitable for individuals with autism and complex communication needs, and reduce challenging behaviors. She teaches courses on autism, intervention strategies, and behavior management. Dr. Boesch is also the co-author of the book: Implementing Effective Augmentative and Alternative Communication Practices for Students with Complex Communication Needs: A Handbook for School-Based Practitioners.
Endia J. Lindo, Ph.D. is an Associate Professor of Special Education in the College of Education at Texas Christian University and core faculty in the Alice Neeley Special Education Research and Service (ANSERS) Institute. Her research focuses on improving the reading outcomes of students with disabilities. Of particular interest are approaches to teaching reading, improving the implementation and sustainability of research-based interventions, enhancing educators’ cultural competence, and understanding the influence of social and familial factors on students’ educational outcomes.
To return to the main page for NASET’s Autism Spectrum Disorder Series – Click Here